
The Graphical Developer Interface
| Home | |
 |
Back To Tips Page |
 |
The Graphical Developer Interface |
|
We talk a lot about GUI applications, GUI design, and GUI controls. But we're developers! Shouldn't we be concerned with the Graphical Developer Interface? I'd call it the GDI, but Microsoft has already taken that acronym for another purpose.
This essay discusses what I do when I'm developing an application, and even has some downloadable code samples for you to play with. These code samples represent about 35 years of doing message logging and a decade of maturing a very sophisticated logging methodology. I wrote the first version of this control, far simpler and more primitive, a decade ago for my first Windows program. It was the natural outgrowth of a system I'd developed five years before on MS-DOS, which was based on techniques I'd used as far back as 1965. In those days, I kept an event log by (get this!) punching out cards! Out-of-band tracing has been a technique I've used for years. One of the first programs I published was an adaptation of a 1401 trace program.
Far too many questions appear on the Microsoft newsgroups of the forms shown below:
All of these questions show a flawed approach to the problem. Years of conditioning of using debug print statements has forced them into the mode that you write out byte streams to a console for debugging.
I should point out that I am always suspicious of cout <<. The first thing most C++ books tell you is that cout is cool because you don't have to learn printf formatting. Yeah, big deal. It makes it easy for the beginner writing a first program to produce output. After that, its value is problematic. I write programs in the range of 20,000 to 150,000 lines of code, and the percentage of lines that involve sprintf-style formatting are so small as to be almost irrelevant. Besides, by the time you can write a system on the order of 100K lines, you're smart enough to have figured out sprintf, anyway.
This was always a lousy approach, and years ago, when I wrote MS-DOS apps, I developed far better ways of handling the problem. The nice thing is that once you have developed the tools, they continue to be reusable in a variety of contexts.
What are the real goals of something as simple as debug output? And what do you really want to do to support debugging?
I discuss some of the high-level concepts in this essay, and in an accompanying essay I have the details of a full-blown CListBox-derived logging class.
If you add debug print statements, never remove them. If you needed the output to debug version 1.0, you'll need it for 1.1, 1.2, 2.0, 2.1, etc. So why remove them?
There are two very effective ways of "removing" debug print statements: conditional compilation and if. Most of the time, I choose the if method.
Why? Why leave all that stuff cluttering up the release version? It only makes the executable larger and slower!
First, read my essay on why optimization is your worst enemy. It is silly to think that a 1% change in the size of your executable is going to make any difference whatsoever. Since any MFC executable is already a massive memory footprint, don't think "embedded system on 16K ROM", think "MFC application in 32MB system". When you look at it this way, any excuse for removing your debug output statements becomes silly.
Why leave debug features in?
One answer, and I think a most compelling one: Technical Support.
I leave all my debug output in the product, and it really simplifies tech support. With a few magic incantations, I can explain to the customer over the phone what to do, and get a debug log which can be emailed to me. This almost always helps me isolate what is going on. In fact, many of the enhancements that go into each release's debug output logic are based on situations where my debug output wasn't adequate for the task.
Build an application designed for Technical Support. No two error conditions should produce the same message. Every error message should contain informative information both to the user and your tech support people. You should never, ever issue a MessageBox that says "File Open Error". It is absolutely trivial to include the file name, the error number, and the text explanation of the error message in a MessageBox. Do it. Anything less is just sloppy programming. Furthermore, it should not just say the name of the file; it should indicate, in a meaningful fashion, just what the purpose of the file open was. For example,
File Open Error Auxiliary configuration file c:\Program Files\MyApplication\AuxData.dat Error code 2: File Not Found |
at the very least. A minimum of four parameters, if you put this in a general-purpose subroutine (which you should!): the UINT of the error message string, the UINT of the source location, the LPCTSTR of the filename, and the DWORD error number. From the error number you can FormatMessage the error text.
An internal error, something which represents a program malfunction, should include both __FILE__ and __LINE__. Note that you should not use the THIS_FILE variable which MFC declares for you, because it suppresses this in release mode.
How I deal with this will be explained shortly, when I talk about system design aspects. I should point out that these are sufficiently basic to my programming paradigm that nearly every application I deliver has them built in.
Selecting debugging options is usually the easiest feature to implement. Just create a dialog with a set of check boxes, have the check boxes maintain some variables which your program queries, and you're done.
For example, here's a screen snapshot of the debug options dialog of one of my applications: (In some of these snapshots, you'll find certain parts obscured; these represent information I think is possibly sensitive).
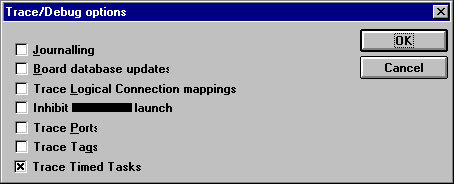
You can create a set of variables to hold these values. This is one of the few times I create global variables, because they are read-only except in the dialog handler. Code for updating them looks much like the following:
void CMyApp::OnDebugOptions()
    {
     CDebugTraceDialog dlg;
     dlg.m_Journalling = debug_Journalling;
     dlg.m_DatabaseUpdates = debug_DatabaseUpdates;
     dlg.m_TraceMappings = debug_TraceMappings;
     dlg.m_InhibitLaunch = debug_InhibitLaunch;
     dlg.m_TracePorts = debug_TracePorts;
     dlg.m_TraceTags = debug_TraceTags;
     dlg.m_TraceTasks = debug_TraceTasks;

     dlg.DoModal();

     debug_Journalling = dlg.m_Journalling;
     debug.DatabaseUpdates = dlg.m_DatabaseUpdates;
     // .. you get the idea
    }
The dialog is a very simple use of member variables; each control has a value variable member of type BOOL. Then I can put tests in my code such as
if(debug_TraceTags)
    { /* tag trace */
     // ... debug output here
    } /* tag trace */
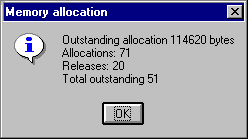
But you can do anything you want in a dialog. For example, here's a case where I just use a MessageBox to output some memory statistics.
I've even done things like create menu items that are always disabled and whose text is performance information! For example, here's one where I monitor certain performance statistics:
The code to do this is in the ON_UPDATE_COMMAND_UI handler, and is
void CMyApp::OnUpdateOutstanding(CCmdUI * pCmdUI)
    {
     CString fmt;
     fmt.LoadString(IDS_STATISTICS_FMT);
     CString s;
     s.LoadString(fmt, created, destroyed, current, maxRequests);
     pCmdUI->Enable(FALSE);
     pCmdUI->SetText(s)
    }
Admittedly this is slightly harder to read because of the grayout, but it reduced the checking to a single mouse click. I could then look for evidence of storage leaks in the objects I was managing as I did various operations.
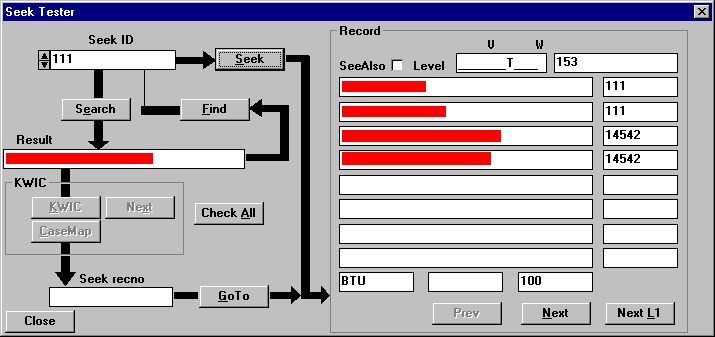
Of course, you can debug by using the moral equivalent of printf statements, and look at everything in terms of the debugger representation. But when I had a complex encoded database which exhibited certain pathologies, it was clearly going to be a lot of work to find out even where the pathologies were, let alone finding why the code broke at those points. So I spent a day creating the dialog shown below (does it look antique? It is in a Win16 application that still runs! As before, I've blanked out the critical information; what is important is that the "Record" box shows up to four levels of keyword access, the sort-by key and display-as key for each level. In the example below, the keys are identical (111/111 and 14542/14542, which are indexes into the controlled-vocabulary table). By typing values into the various boxes and clicking the various buttons I could then exercise the underlying database engine. Note the bug: the vertical arrow from Find to Seek ID draws as a single line; I never got up-arrow to work in the custom control I did. Oh well. But the result was that after a day of playing with this really nice interface, I had exercised all of the paths of the underlying database engine. The time spent developing this (except for the arrow control, which I did purely for amusement, and which I've reused many times) was actually negative time, because without the time spent developing it, the time spent debugging the code would have taken longer than the time to develop this dialog and debug the code using it.
Whenever I implement a right-click (context) menu, I usually put a few debug-relevant items in the menu. When I get to the point where I'm about to do TrackPopupMenu, I look at some debug flag that controls this aspect of the system. If the flag is FALSE, I delete the debug menu items; if it is TRUE, I leave them in. Here's a little dialog that pops up from a listbox context-sensitive menu; it reports on the state of the current selection.
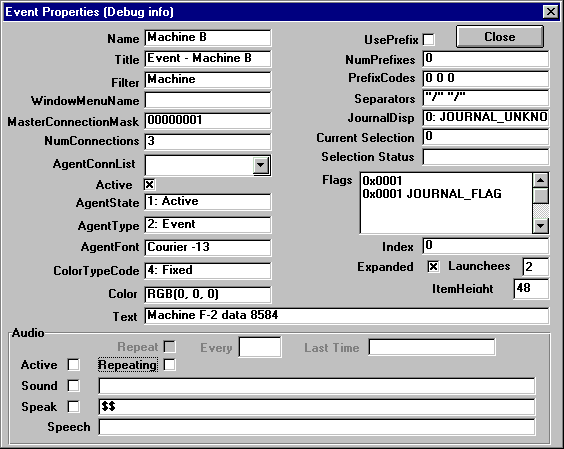
The "Flags" item is a listbox that gives not only the hex flag value, but for each bit that is set it decodes the bit. While these look like active controls, they are actually read-only controls, including the check boxes (use style Check Box instead of Auto Check Box). Every time I wanted to find out more about the object represented in the list box, I added a new set of controls. I spent ten minutes adding the expanded, Launchees, and ItemHeight items and saw immediately what the problem was. It would have taken me longer to debug it with a conventional debugging approach.
I have a lot of different techniques for doing debug menus, and I choose among them on a per-project basis. The first and simplest is the one used for most applications, the simple Debug menu, shown in a previous figure. I usually put it out beyond the Help menu. I create it in the usual way, in the resource editor. You treat it like any other menu; for example, different views may have different Debug menus. For now, assume that it will always exist.
You add the usual handlers, the usual ON_UPDATE_COMMAND_UI handlers (well, except for the occasional odd one like I just showed above. The menu items can set state, have checkmarks, launch dialogs, and so on. But their sole purpose is to help you, the developer.
Of course, you don't want it to really always exist. That's why that last item says "Hide This Menu". That's one way to make it disappear. But what I usually do is have a Registry key called Debug, under which I store all sorts of useful information, one of which is the key Menu, which has a value of TRUE if I want the menu to appear and FALSE if I want the menu to be hidden. There is global variable, something like isDebugMenu, that is set to this value on startup. The Hide This Menu option sets this value.
void removeDebugMenu(CWnd * wnd)
    {
     if(isDebugMenu)
        return; // do not remove if we want it
     CMenu * menu = wnd->GetMenu();
     int limit = menu->GetMenuItemCount();
     for(int i = 0; i < limit; i++)
        { /* scan items */
	 CMenu * sub = menu->GetSubMenu(i);
	 if(sub == NULL)
	     continue;
	 if(sub->GetMenuState(IDM_DEBUG_HIDE, MF_BYCOMMAND) == (UINT)-1)
	     continue; // not here
         // we have the menu item in hand
	 menu->DeleteMenu(i, MF_BYPOSITION);
	 wnd->DrawMenuBar();
	 return;
	} /* scan items */
    }
This function will remove the menu if we are not in debug mode. Otherwise, it locates the debug menu and removes it. There are several important features of this code that you must not neglect.
You cannot assume the menu is in a fixed position in the menu bar. Do not encode it as offset 7, or 9, or whatever. You will always lose if you do this. Always. The first thing to note is that any use of MF_BYPOSITION in dealing with menus is always wrong unless the position has been computed by immediately preceding code. The number of times I've been done in by somebody else's code using MF_BYPOSITION with hardwired constants is so high that the first thing I do in preparing to maintain someone else's code is search for any instances of MF_BYPOSITION and rewrite them to be sane. If you still don't believe me, read my essay on Who Owns the GUI.
So using this technique, I find which top-level menu is the debug menu by searching for the menu that contains the hide-the-debug-menu item, then delete that menu. Having deleted the menu, I then call DrawMenuBar to guarantee the menu is redrawn properly.
In an MDI app, the top-level menu is replaced for each view. This means that this function has to be called each time a new view gets attention. What you have to do is add the ActivateFrame virtual method to your view, which you can do from the ClassWizard. Then fill it in with a call to removeDebugMenu, as shown below:
void CPupFrame::ActivateFrame(int nCmdShow)
{
       CMDIChildWnd::ActivateFrame(nCmdShow);

       removeDebugMenu(AfxGetMainWnd());
}
I do a number of applications that are CPropertyPage-based. In such a
case, if the debug mode is set when the application starts, I get one or more
additional tabs on the property page. For example, in the picture below,
the "Events" and "Debug" tabs do not appear in normal mode.
Note the little collection of edit boxes in the center; this let me test a
collection of integer-to-decimal conversion routines (the application did not
use floating point and I had to test each of the scaled integer conversions plus
a dozen special ones like date and time).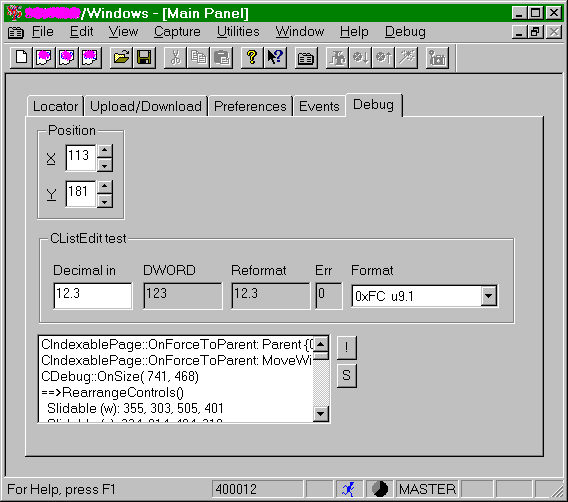
I usually record the debug state in a Registry variable. This makes it easy to do the debugging. But you definitely do not want an end user trying to use RegEdit to set the state. What I usually do is bury the setting of this option under some Options dialog, and often under a button called Advanced... which brings up a dialog with a checkbox to set the debugging mode. Usually, exiting this dialog generates a MessageBox that says something like "You are entering dangerous territory. If you are not doing this under direction of Technical Support, you are on your own to hope that this does not adversely affect your system or application performance". The Hide This Menu item will clear the state in the Registry.
Sometimes I just do it by hiding all the controls. Take a look at this version of a dialog-based app when Advanced is checked, and compare it with the relatively sparse area that appears in the normal mode of operation.

There are a number of ways of doing debug printout. The obvious ones that strike pre-Windows programmers are printf and cout. Consider these dead technology.
I use a CListBox as my preferred logging mechanism. It is far more flexible than CEdit. It is also easier to use. While you may not believe this at first, try using a CEdit for a logging mechanism and you'll quickly change your mind.
A CListBox is not as easy to use as you might think. The second-order and third-order effects become dominant. The nice thing is that you only have to solve these problems once, and if you download the code that accompanies this essay, you have to solve them zero times.
My own favorite is the owner-draw listbox, because it gives me maximum flexibility. This is what you'll find in my code. But we'll ignore that fine point for a while.
To do simple logging, add a CListBox into your application in some appropriate venue. I've found that modeless dialogs and CFormView-derived MDI documents are good places to do this, or I put one in a dialog-based app. Sometimes I'll create a whole separate tab in a CPropertySheet-based app and put it there.
Assuming you have such a CListBox control, debug printout is easy: Create a control-type member variable (see my essay on Avoiding GetDlgItem if you don't know how to do this), and give it a useful name such as c_Log.
if(trace_Whatever)
    {
     CString s;
     CString fmt;
     fmt.LoadString(IDS_FORMAT_WHATEVER);
     s.Format(fmt, value1, value2, value3);
     c_Log.AddString(s);
    }
You will find that after a while this doesn't really do the job. It doesn't scroll, you can't save it, and if you are running on toy operating systemoids like Win9x you soon run out of available space (usually around 3000 entries in the list box, depending on the length of the strings you write). This has the charming property that it crashes the entire system.
The trace class I provide allows for such features as limiting the number of lines of trace output, provides intelligent scrolling, provides a file save, and as a side benefit allows you to use multiple colors, for example to indicate errors in red, comments in green, data trace in blue, etc.
The ultimate version of this is shown in the snapshot below.
This is a dialog-based control panel for an application that actually runs as a server/server hybrid. It is a private server to another application, and a public server for UDP packets (no, I didn't invent the protocol, it is third-party). This is normally an invisible application, lurking in the tray of the toolbar. Double-clicking the tray icon will pop it up, as indicated by one of the messages in the middle of the log. Green messages are informational, red are errors, and blue are data transmission. The first column is a port number (the first three messages are for port 2, the last three for port 1), the second column is a thread ID (this is a heavily multithreaded server), then there's a timestamp, and finally a text message.
I can elect to limit the log size (this runs on NT, so I don't have to). The Error Search buttons let me find the errors in the log so I don't have to scroll around. The Save... button will write the contents as text to a file.
This class is reused in a large number of my applications. Therefore, it was worth spending some time to make it truly spiffy.
What you have here is a very mature debug log mechanism. While you may have slightly different needs that I did, this is a far better starting place than printf, cout, creating console windows, using edit controls, or just using a plain CListBox.
![]()
The views expressed in these essays are those of the author, and in no way represent, nor are they endorsed by, Microsoft.