
To Log or not to Log: That is the question:
How to compute log2(n) efficiently
|
|
Home |
 |
Back To Tips Page |
 |
To Log or not to Log: That is the question:
|
|
One of the ways to tell a new programmer is by how they compute powers-of-2 functions. For example, if you need 2n, a beginner will write
UINT v = (UINT)pow(2, n);
which is obviously about the worst possible way to do this computation. An experienced programmer will always write
UINT v = 1 << n;
which is substantially faster.
A recent question in the newsgroup was based on a question of the form "Given I have a value v which is known to be a power of 2, how can I find the value n = log2(v) value?"
There were several algorithms posed. These included
UINT n;
for(n = -1; v > 0; v <<= 1, n++);
One proposal was to write
UINT n = (UINT)log2(v);
which of course isn't possible because there is no log2 function. The counterproposal was to code it as
UINT n = (UINT)(log(v)/log(2));
which uses the natural log, and an alternative was
UINT n = (UINT)(log10(v)/log10(2));
I knew an even faster way that works when the value is known to be a power-of-2, so I decided to compare the versions to see what their performance was.
The fast method is to use the bsf (bit scan forward) instruction, which identifies the position of the first nonzero bit in a value.
From the Intel manual:
|
BSF—Bit Scan Forward Description Searches the source operand (second operand) for the least significant set bit (1 bit). If a least significant 1 bit is found, its bit index is stored in the destination operand (first operand). The source operand can be a register or a memory location; the destination operand is a register. The bit index is an unsigned offset from bit 0 of the source operand. If the content of the source operand is 0, the content of the destination operand is undefined. |
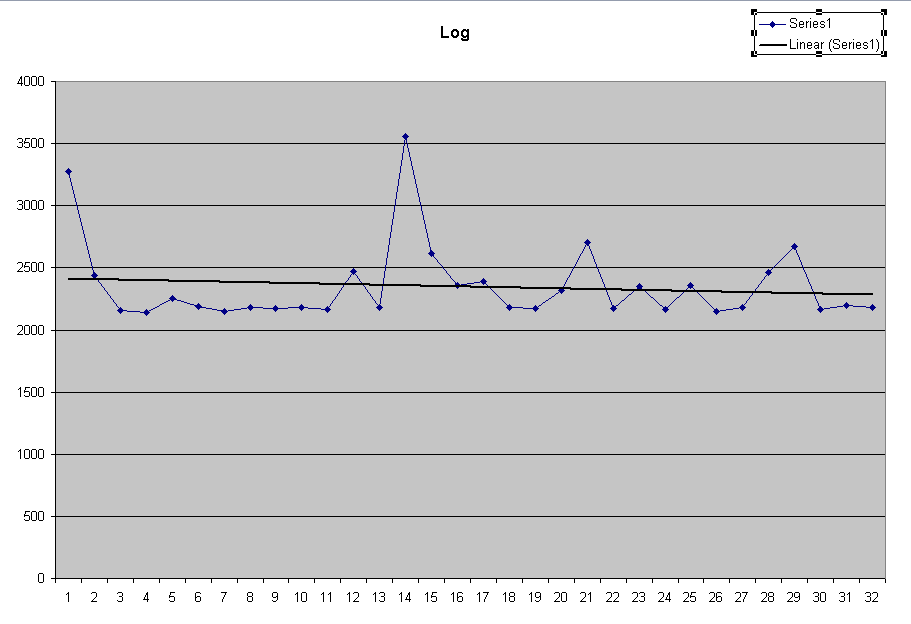
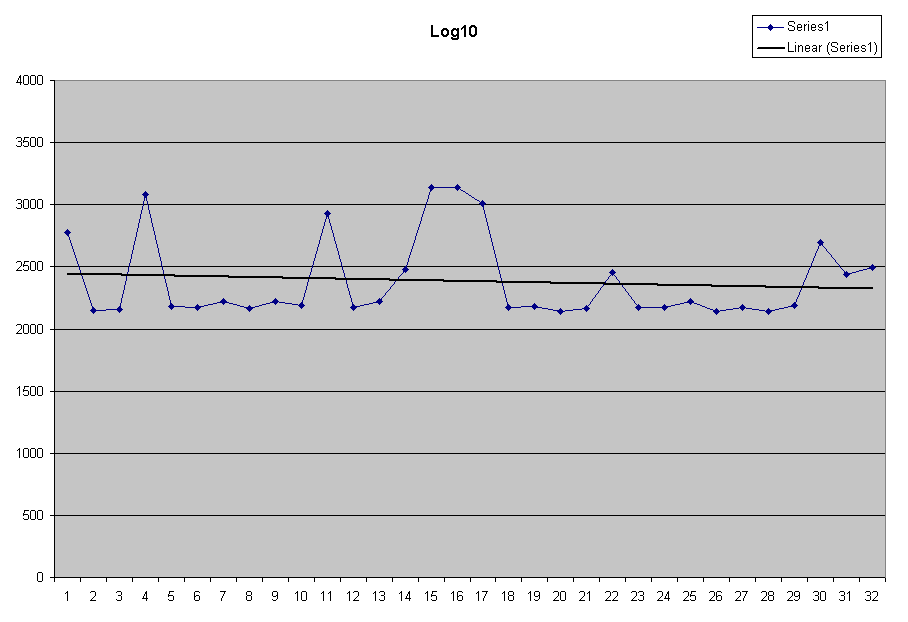
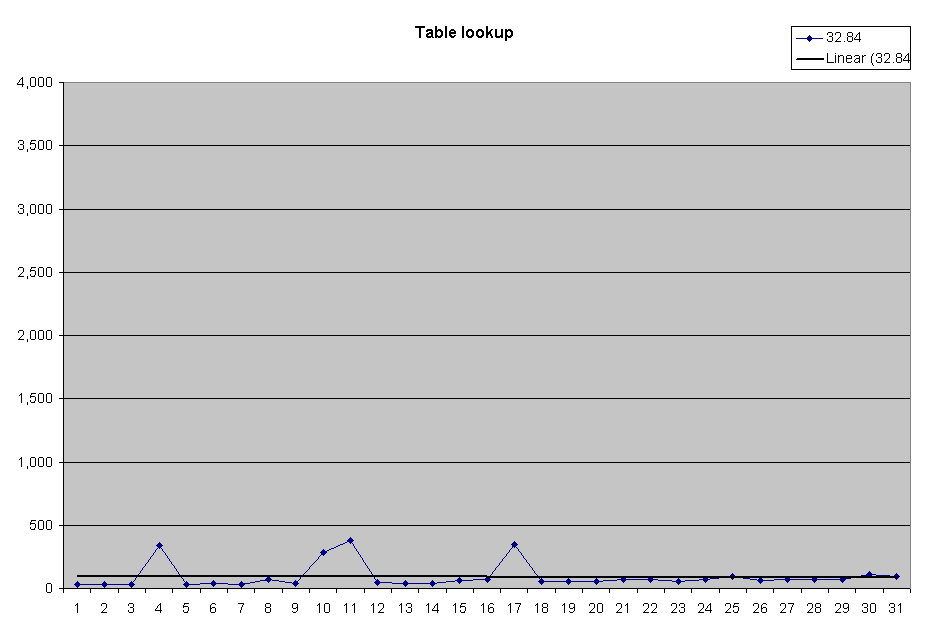
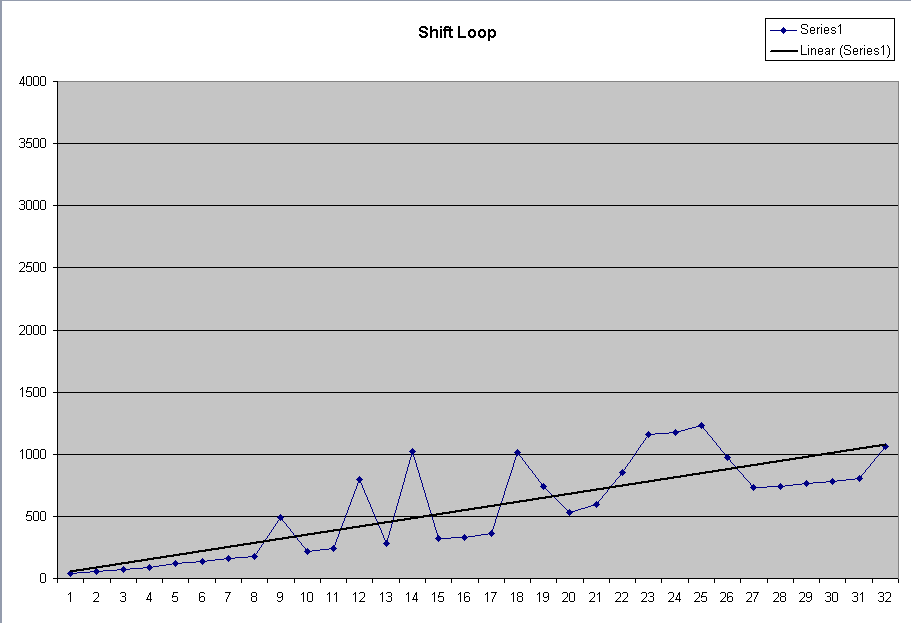
I wrote a program that computed the time to do 10,000 instances of the computation, and it wrote this inofmration out in a form that could be imported into an Excel spreadsheet.
Note that there are always timing anomalies caused by interrupts and other factors, so the data is a bit spiky at times. However, the summary is given in the table below. The average values were obtained from observing the linear trendline.
The basic computations were designated by the following algorithms (arranged in descending order of efficiency):
| Method | Code | Timing |
Performance |
| Log |
UINT LogTest(UINT n) { return (UINT)(log((double)n)/log((double)2)); }
|
2400 μsec | 200 |
| Log10 |
UINT Log10Test(UINT n) { return (UINT)(log10((double)n)/log10((double)2)); }
|
2400 μsec | 200 |
| Shift |
UINT ShiftTest(UINT n)
    {
     UINT result;
     for(result = -1; n > 0; n >>= 1, result++) ;
     return result;
    }
|
42..1065 μsec |
3.5..88.75 |
| Lookup |
UINT TableTest(UINT n)
    {
#define X (BYTE)-1
     const static BYTE table[256] ={X,  0,  1,  X,  2,  X,  X,  X,  // 0..7
                                    3,  X,  X,  X,  X,  X,  X,  X,  // 8..15
                                    4,  X,  X,  X,  X,  X,  X,  X,  // 16..23
                                    X,  X,  X,  X,  X,  X,  X,  X,  // 24..31
                                    5,  X,  X,  X,  X,  X,  X,  X,  // 32..39
                                    X,  X,  X,  X,  X,  X,  X,  X,  // 40..47
                                    X,  X,  X,  X,  X,  X,  X,  X,  // 48..55
                                    X,  X,  X,  X,  X,  X,  X,  X,  // 56..63
                                    6,  X,  X,  X,  X,  X,  X,  X,  // 64..71
                                    X,  X,  X,  X,  X,  X,  X,  X,  // 72..79
                                    X,  X,  X,  X,  X,  X,  X,  X,  // 80..87
                                    X,  X,  X,  X,  X,  X,  X,  X,  // 88..95
                                    X,  X,  X,  X,  X,  X,  X,  X,  // 96..103
                                    X,  X,  X,  X,  X,  X,  X,  X,  // 104..111
                                    X,  X,  X,  X,  X,  X,  X,  X,  // 112..119
                                    X,  X,  X,  X,  X,  X,  X,  X,  // 120..127
                                    7,  X,  X,  X,  X,  X,  X,  X,  // 128..135
                                    X,  X,  X,  X,  X,  X,  X,  X,  // 136..143
                                    X,  X,  X,  X,  X,  X,  X,  X,  // 144..151
                                    X,  X,  X,  X,  X,  X,  X,  X,  // 152..159
                                    X,  X,  X,  X,  X,  X,  X,  X,  // 160..167
                                    X,  X,  X,  X,  X,  X,  X,  X,  // 168..175
                                    X,  X,  X,  X,  X,  X,  X,  X,  // 176..183
                                    X,  X,  X,  X,  X,  X,  X,  X,  // 184..191
                                    X,  X,  X,  X,  X,  X,  X,  X,  // 192..199
                                    X,  X,  X,  X,  X,  X,  X,  X,  // 200..207
                                    X,  X,  X,  X,  X,  X,  X,  X,  // 208..215
                                    X,  X,  X,  X,  X,  X,  X,  X,  // 216..223
                                    X,  X,  X,  X,  X,  X,  X,  X,  // 224..231
                                    X,  X,  X,  X,  X,  X,  X,  X,  // 232..239
                                    X,  X,  X,  X,  X,  X,  X,  X,  // 240..247
                                    X,  X,  X,  X,  X,  X,  X,  X   // 248..255
                                   };
     union {
        UINT v;
        BYTE b[4];
     } value;
     value.v = n;
     if(value.b[0] != 0)
        return table[value.b[0]];
     if(value.b[1] != 0)
        return table[value.b[1]] + 8;
     if(value.b[2] != 0)
        return table[value.b[2]] + 16;
     if(value.b[3] != 0)
        return table[value.b[3]] + 24;
     return X;  // this is actually an error
    } // TableTest
#undef X
|
93 μsec | 7.75 |
| BSF |
UINT BSFTest(UINT n) { _asm bsf eax, n }
|
35 μsec |
2.92 |
| BSF Fast |
UINT __fastcall FastBSFTest(UINT n) { _asm bsf eax, ecx }
|
12 μsec |
1.0 |
Note that the performance ratio here is 200:1 between the log approach and the fastest bsf approach. The bsf approach is x86-specific because it relies on the instruction set of the target machine. The particular code, using a __asm insertion, is also not compatible with 64-bit x86 platforms.
In the table-based approach, a table of 256 values is indexed by the integer value in one byte of the value n. There are entries in locations 0, 1, 2, 4, 8, 16, 32, 64 and 128, representing the values 0x00, 0x01, 0x02, 0x04, 0x08, 0x10, 0x20, 0x40 and 0x80. The values in the table will be, respectively, 0, 1, 2, 3, 4, 5, 6, and 7. All other values are irrelevant (remember, the algorithms are based on the fact that only one bit of the value is set). With no more than four lookups, the correct value can be found, and the result is modified by the position in the word where the value is found. Starting at the low-order byte, successive bytes are accessed; the first nonzero byte gives the index, and each zero byte adds 8 to the log value. This code is compiler-independent, but it is not platform-independent in that the byte accesses would have to be in the reverse order on a big-endian machine such as a Sun SPARC computer.
| Using the log approach, the conversion
time is more or less constant. Note that the huge spikes are probably
artifacts of interrupts coming in and perturbing the behavior. Note the typical value is around 2400 μsec. |
 |
| The computation using the log10 function
is essentially the same performance as the log performance. Note the typical value is around 2400 μsec. |
 |
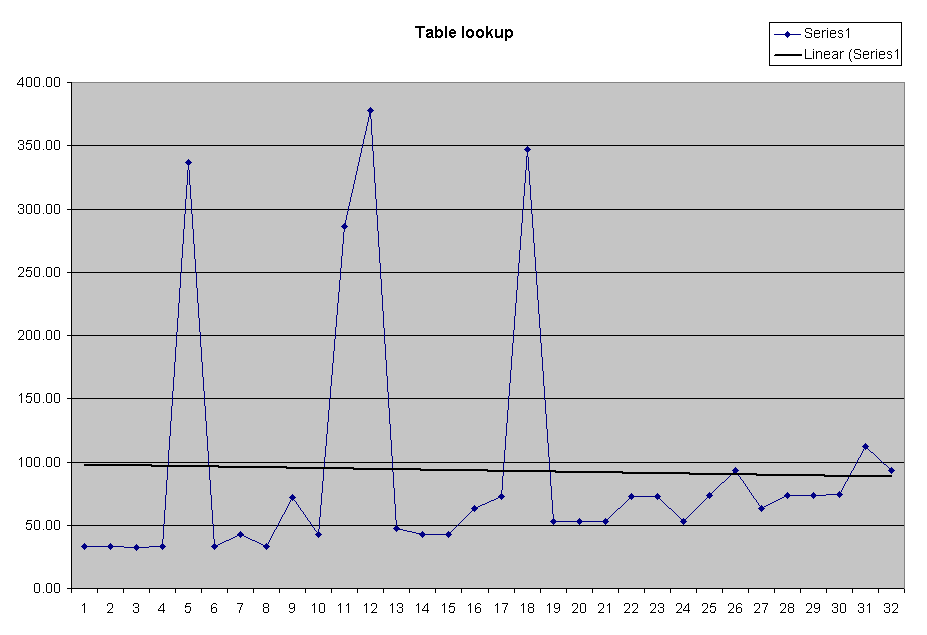
| The table lookup
exhibits approximately linear behavior, modulo the artifacts apparently due
to interrupts.
The details of performance can be seen more clearly in the expanded scale graph. |
 |
| Using the shift algorithm, note that the time
required for the algorithm increases with the number of shifts required. The approximate times are 42..1065 μsec. |
 |
| Using the bsf instruction is very fast.
Shown to the same scale as the above, it is obvious how fast it is. For finer timing, see the expanded scale graph. |
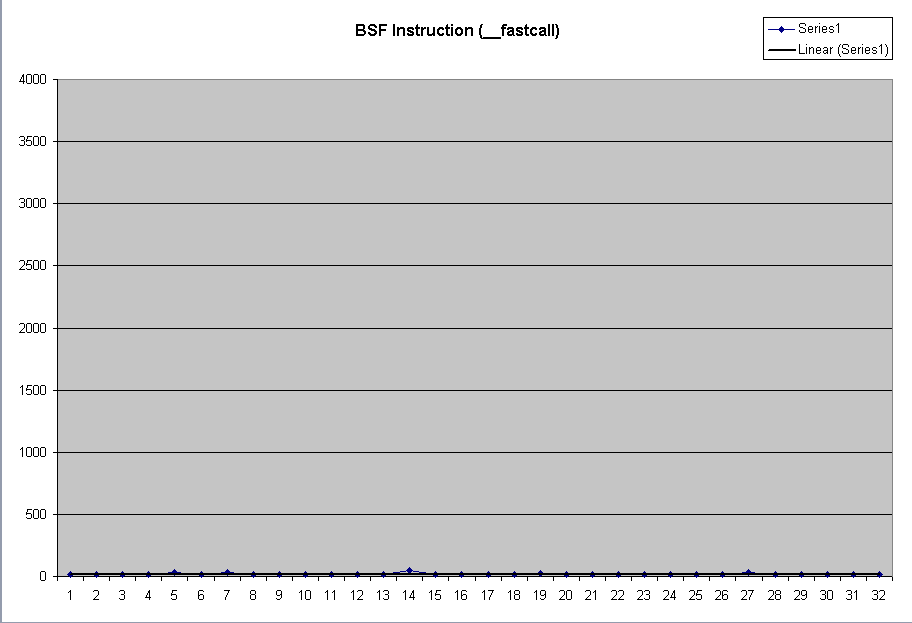 |
| However, using the __fastcall linkage we
get even more speed. Again, this is to the same scale as the above. For finer timing see the expanded fastcall graph. |
 |
|
Expanding the scale of the lookup graph shows
that the performance is approximately flat, except for the spikes. The computed average is 93 μsec, but the typical values are below 50 μsec. Note that there appears to be a slight increase of the cases 9..16 over 1..8, and 17..24 is slightly higher, and 25..32 just slightly higher, which examining the code will demonstrate is the expected behavior. |
 |
| Expanding the scale of the bsf graph, we see that the data is very noisy, but if we ignore the huge spikes (again, most likely caused by interrupts; note that the effect is magnified at this scale), then the typical time is constant and appears to be around 35 μsec. | 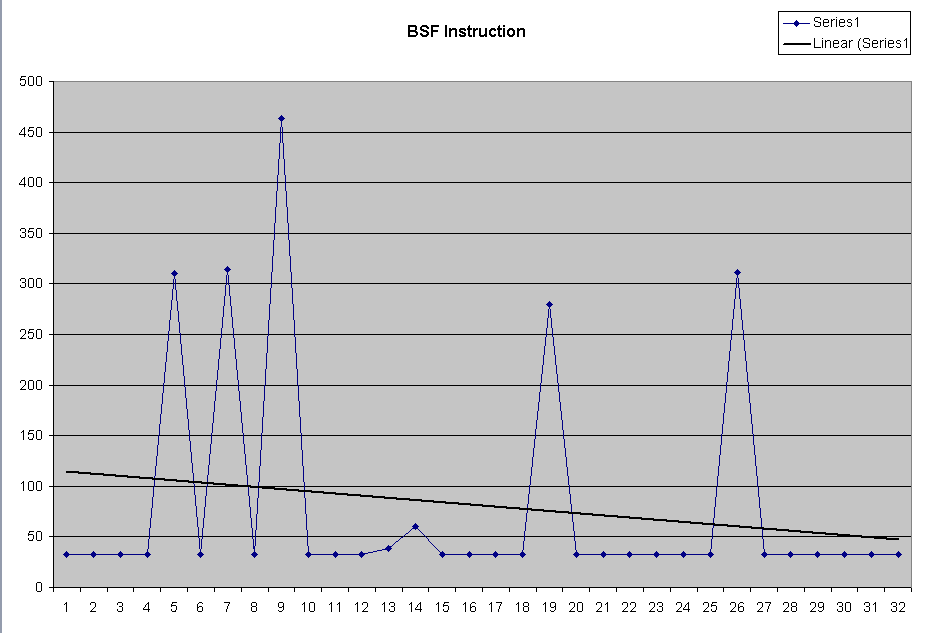 |
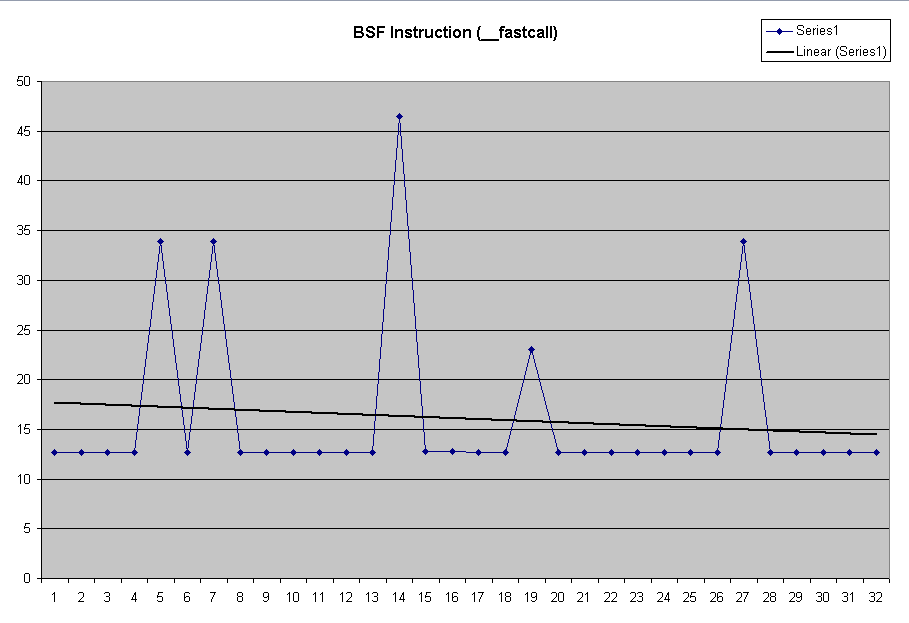
| Expanding the scale of the __fastcall bsf chart, we see that the typical times are around 12 μsec. |
 |
Machine code for the functions:
| Log |
00000 8b 44 24 04 mov eax, DWORD PTR _n$[esp-4] 00004 db 44 24 04 fild DWORD PTR _n$[esp-4] 00008 85 c0 test eax, eax 0000a 7d 06 jge SHORT $L64881 0000c dc 05 00 00 00 00 fadd QWORD PTR __real@41f0000000000000 $L64881: 00012 d9 ed fldln2 00014 d9 c9 fxch ST(1) 00016 d9 f1 fyl2x 00018 dd 05 00 00 00 00 fld QWORD PTR __real@4000000000000000 0001e d9 ed fldln2 00020 d9 c9 fxch ST(1) 00022 d9 f1 fyl2x 00024 de f9 fdivp ST(1), ST(0) 00026 e9 00 00 00 00 jmp __ftol2 |
| Log10 |
00000 8b 44 24 04 mov eax, DWORD PTR _n$[esp-4] 00004 db 44 24 04 fild DWORD PTR _n$[esp-4] 00008 85 c0 test eax, eax 0000a 7d 06 jge SHORT $L64889 0000c dc 05 00 00 00 00 fadd QWORD PTR __real@41f0000000000000 $L64889: 00012 d9 ec fldlg2 00014 d9 c9 fxch ST(1) 00016 d9 f1 fyl2x 00018 dd 05 00 00 00 00 fld QWORD PTR __real@4000000000000000 0001e d9 ec fldlg2 00020 d9 c9 fxch ST(1) 00022 d9 f1 fyl2x 00024 de f9 fdivp ST(1), ST(0) 00026 e9 00 00 00 00 jmp __ftol2 |
| Note that instead of calling __ftol2 and then returning, it merely does a jmp to the subroutine, relying on the ret from __ftol2 to return to the caller of this function. This is a frequent trick of optimizing compilers. | |
_ftol2 |
_ftol2: 00401498 55 push ebp 00401499 8B EC mov ebp,esp 0040149B 83 EC 20 sub esp,20h 0040149E 83 E4 F0 and esp,0FFFFFFF0h 004014A1 D9 C0 fld st(0) 004014A3 D9 54 24 18 fst dword ptr [esp+18h] 004014A7 DF 7C 24 10 fistp qword ptr [esp+10h] 004014AB DF 6C 24 10 fild qword ptr [esp+10h] 004014AF 8B 54 24 18 mov edx,dword ptr [esp+18h] 004014B3 8B 44 24 10 mov eax,dword ptr [esp+10h] 004014B7 85 C0 test eax,eax 004014B9 74 3C je integer_QnaN_or_zero (4014F7h) arg_is_not_integer_QnaN: 004014BB DE E9 fsubp st(1),st 004014BD 85 D2 test edx,edx 004014BF 79 1E jns positive (4014DFh) 004014C1 D9 1C 24 fstp dword ptr [esp] 004014C4 8B 0C 24 mov ecx,dword ptr [esp] 004014C7 81 F1 00 00 00 80 xor ecx,80000000h 004014CD 81 C1 FF FF FF 7F add ecx,7FFFFFFFh 004014D3 83 D0 00 adc eax,0 004014D6 8B 54 24 14 mov edx,dword ptr [esp+14h] 004014DA 83 D2 00 adc edx,0 004014DD EB 2C jmp localexit (40150Bh) positive: 004014DF D9 1C 24 fstp dword ptr [esp] 004014E2 8B 0C 24 mov ecx,dword ptr [esp] 004014E5 81 C1 FF FF FF 7F add ecx,7FFFFFFFh 004014EB 83 D8 00 sbb eax,0 004014EE 8B 54 24 14 mov edx,dword ptr [esp+14h] 004014F2 83 DA 00 sbb edx,0 004014F5 EB 14 jmp localexit (40150Bh) integer_QnaN_or_zero: 004014F7 8B 54 24 14 mov edx,dword ptr [esp+14h] 004014FB F7 C2 FF FF FF 7F test edx,7FFFFFFFh 00401501 75 B8 jne arg_is_not_integer_QnaN (4014BBh) 00401503 D9 5C 24 18 fstp dword ptr [esp+18h] 00401507 D9 5C 24 18 fstp dword ptr [esp+18h] localexit: 0040150B C9 leave 0040150C C3 ret |
| Shift code |
00000 8b 4c 24 04 mov ecx, DWORD PTR _n$[esp-4] 00004 83 c8 ff or eax, -1 00007 85 c9 test ecx, ecx 00009 76 0c jbe SHORT $L64757 0000b eb 03 8d 49 00 npad 5 $L64755: 00010 d1 e9 shr ecx, 1 00012 40 inc eax 00013 85 c9 test ecx, ecx 00015 77 f9 ja SHORT $L64755 $L64757: 00017 c3 ret 0 |
| bsf |
00000 0f bc 44 24 04 bsf eax, DWORD PTR _n$[esp-4] 00005 c3 ret 0 |
| __fastcall bsf |
00000 0f bc c1 bsf eax, ecx 00003 c3 ret 0 |
| Lookup |
00000 8b 44 24 04 mov eax, DWORD PTR _n$[esp-4] 00004 84 c0 test al, al 00006 74 0b je SHORT $L64727 00008 0f b6 c0 movzx eax, al 0000b 0f b6 80 00 00 00 00 movzx eax, BYTE PTR ?table@?1??TableTest@@YAIII@Z@4QBEB[eax] 00012 c3 ret 0 $L64727: 00013 84 e4 test ah, ah 00015 74 0e je SHORT $L64728 00017 0f b6 cc movzx ecx, ah 0001a 0f b6 81 00 00 00 00 movzx eax, BYTE PTR ?table@?1??TableTest@@YAIII@Z@4QBEB[ecx] 00021 83 c0 08 add eax, 8 00024 c3 ret 0 $L64728: 00025 8a 44 24 06 mov al, BYTE PTR _n$[esp-2] 00029 84 c0 test al, al 0002b 74 0e je SHORT $L64729 0002d 0f b6 d0 movzx edx, al 00030 0f b6 82 00 00 00 00 movzx eax, BYTE PTR ?table@?1??TableTest@@YAIII@Z@4QBEB[edx] 00037 83 c0 10 add eax, 16 ; 00000010H 0003a c3 ret 0 $L64729: 0003b 8a 44 24 07 mov al, BYTE PTR _n$[esp-1] 0003f 84 c0 test al, al 00041 74 0e je SHORT $L64730 00043 0f b6 c0 movzx eax, al 00046 0f b6 80 00 00 00 00 movzx eax, BYTE PTR ?table@?1??TableTest@@YAIII@Z@4QBEB[eax] 0004d 83 c0 18 add eax, 24 ; 00000018H 00050 c3 ret 0 $L64730: 00051 83 c8 ff or eax, -1 00054 c3 ret 0 |
One of the problems when trying to synthesize an experiment like this and measuring it under an optimizing compiler is that good optimizing compilers will see through the attempts to repeat a computation and move it outside the loop. This is why it is important when doing performance measurement to actually read the generated assembly code of what is being computed. A test performed in a debug build is essentially meaningless because of the massive debug overheads involved. But in a release compiler, a computation of the form
for(int i = 0; i < MAX_TESTS; i++)
   { /* run test */
    UINT result = TestFunction(n);
   } /* run test */
to first perform the computation of the loop body once, outside the loop. This optimization is known as code motion and in particular it is called alpha motion because the computation is moved to the head of the loop or branch computation (omega motion moves common computations to after the body computation). The reason this can be done is that the computation does not involve any variable dependent on the loop induction variable, so it is loop-invariant code.
UINT result = TestFunction(n);
for(int i = 0; i < MAX_TESTS; i++)
   { /* run test */
   } /* run test */
and then noticing that the loop now has an empty body, and the loop variable is locally scoped, it throws away the computation of the loop entirely!
Therefore, to get valid data for these graphs, I had to defeat the code motion optimization. So I added a "dummy" parameter to the function call so that the code was no longer loop-invariant. My code is therefore
for(int i = 0; i < MAX_TESTS; i++)
   { /* run test */
    UINT result = TestFunction(n, i);
   } /* run test */
While this does perturb the experiment in a minor way, it makes it possible to run the test.
It was also necessary to modify the functions to have __declspec(noinline) which tells the compiler that it may not automatically optimize short functions by essentially expanding them inline. Without this, the function calls were eliminated, and the inlined code was now subject to alpha motion when it was discovered that the expanded code was loop-invariant. Note that my use of the dummy second parameter would have no effect on the code motion optimization, because once the compiler applied the inline expansion rules it would discover that the dummy parameter had no effect and therefore the expanded code would be loop-invariant and could be moved out of the loop. By defeating the ability to do inline optimization, this optimization would be defeated.
What I do to process the data is as follows:
![]()
The views expressed in these essays are those of the author, and in no way represent, nor are they endorsed by, Microsoft.